• Hint: click the "What's New" tab and make that your homepage! On mobile: tap the Lighting Bolt in the upper right corner.
  • After completing the registration form, you will receive an email containing a link that you must select in order to confirm your email is valid. Check your spam/junk folders if you do not receive this message!

Daily Update Morning News - 2026-10-09 (Friday)

Bud

Facula: The Bright Spot
Staff member
Verified Member
United-States
Good morning everyone!

** This is scheduled thread that is automatically generated daily at 6am US CDT Central Daylight Time / 11am UTC. **

Anyone is free to post the daily summary of current & relevant solar or earth events, publications, etc.
 
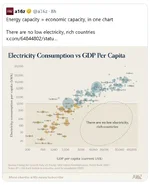
This chart is a little confusing. First of all the bubbles are the population size not the amount of electricity used. The height on the chart is the actual use of electricity per capita. Norway is high, but they have over 98% of their electricity produced by Hydro and solar. I think it needs a lot more explanation.
 
Back
Top